In September, the Fed raised rates for the first time since 2023. Most of us spent last fall building budgets around rate cuts, and the ALCO conversation for the first part of this year was centered on how far funding costs might fall, not how fast they could rise. With the Fed now moving in the other direction, it’s a good time to ask what happens to deposits from here.
The natural place to start is the last hiking cycle. Based on call report data for the roughly 4,150 banks under $10 billion in assets, the median cost of interest-bearing deposits went from 0.34% at the end of 2021 to 2.62% at the end of 2024. Most of us remember that period well. Noninterest-bearing balances moved into accounts that paid a rate, competition for deposits picked up, and cost of funds became a regular topic in every ALCO meeting. What’s interesting is how uneven that increase was. Even after 425 basis points of tightening in 2022, the median cost had only moved to 0.74% by year-end. The bigger adjustment came in 2023 when it climbed another 149 basis points to 2.23%, which was actually more than the 100 basis points the Fed hiked that year.
A big reason that first year was so quiet is that banks didn't really need the money. Balance sheets were full of pandemic deposits, loan demand was soft, and there wasn’t much reason to pay up for funding you had nowhere to put. That cushion bought most institutions about a year before deposit costs started catching up, but balance sheets look a lot different today than they did then. Comparing the same group of banks at the end of 2021 to the middle of this year:
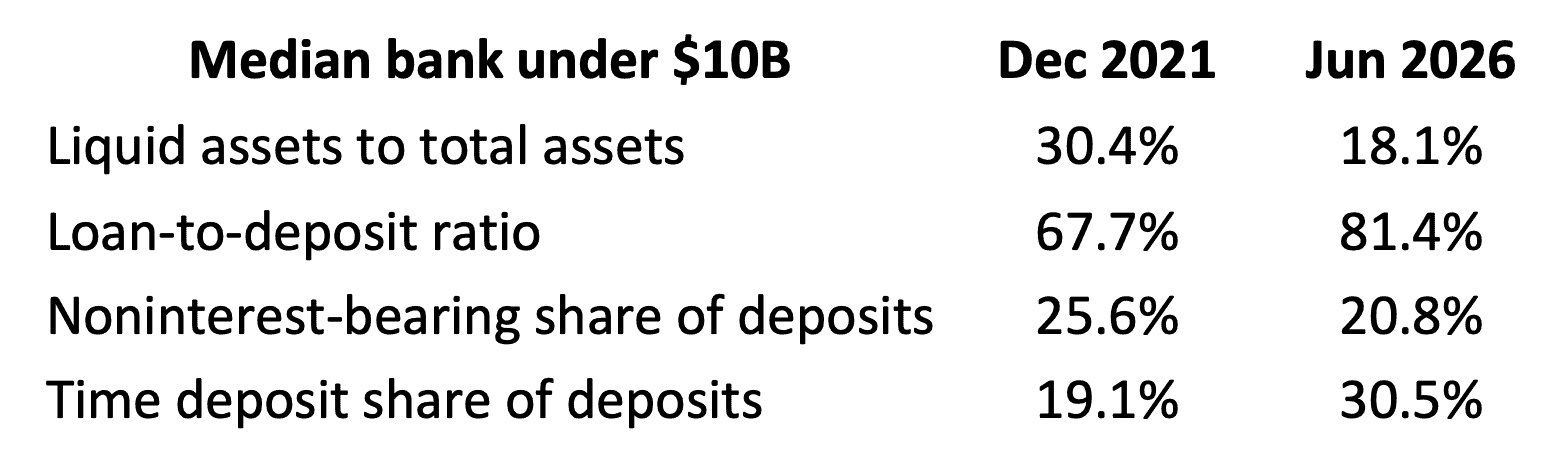
Liquidity is lower, loan-to-deposit ratios are higher, and a smaller share of deposits is sitting in noninterest-bearing accounts. The change I’d pay the most attention to, though, is the growth in time deposits, which now make up close to a third of deposits for the median bank. Unlike a money market account where management has some say in when the rate moves, a CD has a maturity date and it’s going to reprice to the market rate when it gets there. That means a bigger piece of the funding base is going to follow rates on its own schedule regardless of what we decide to do with posted rates.
The other piece of the picture comes from the institutions that run interest rate risk models with The Baker Group (individual results may vary). As the Fed cut rates by 175 basis points from the 2024 peak, the typical institution’s cost of nonmaturity deposits went from 0.68% to 0.67%. NOW account costs actually rose, money market rates are still near their cycle high, and 41% of institutions are paying more on their nonmaturity deposits today than they were at the 2024 peak, even as the Fed was cutting rates. Nearly all the relief that did show up came from CDs repricing lower as they matured.
There are good reasons it played out this way. After working hard to hold onto deposits in 2023, most bankers weren’t in a hurry to cut rates and give customers a reason to shop around, especially with loan-to-deposit ratios where they are. Customers have also gotten a lot more rate aware. They know where the CD specials are, they can move money from their phone in a matter of seconds, and plenty of them have figured out that a Treasury bill works just fine as a savings account. Holding the line has kept balances in the building, which was the right call for a lot of institutions, but it also means this cycle is starting from a higher deposit cost base than the last one did.
Don’t Let 2022 Set Your Betas
When we talk about deposit betas, most of the attention goes to the cumulative number, whether that’s passing through 40% of the Fed’s moves or 50%. For next year’s net interest income, though, the timing matters just as much. Last cycle, excess liquidity gave most banks about a year before deposit costs started catching up. With less liquidity on hand today, I wouldn’t count on that same grace period. If deposits reprice sooner this time, a balance sheet that looks neutral in the model may turn out to be a little more liability sensitive in practice, and the net interest income projection in front of the board may be a bit optimistic in a rising rate scenario.
This doesn’t mean throwing out your historical studies, but it’s worth recognizing which parts of that history were driven by circumstances that have since changed. Running your rising rate scenarios with betas moving faster and earlier than last cycle is a good way to see how sensitive your earnings are to this assumption. The CD maturity schedule is worth a look as well. Management still has a say in what those CDs renew at through the rates and terms offered. But with a larger share of funding sitting in CDs than there was last cycle, how those renewals are priced over the next year will play a bigger role in where funding costs end up.
The same goes for the down-rate side. In a -300 basis point scenario, the median institution’s model expects nonmaturity deposits to supply 55% of its funding relief, which is a lot more than the last cycle delivered. With the Fed hiking, that’s not an immediate concern, but it’s a good reminder to give deposit assumptions a close look in the down-rate scenarios too.
How Far Is the Fed Going?
The good news is that this cycle is starting from a very different place. When the Fed started hiking in March 2022, the funds rate was at zero, and inflation was on its way to a peak above 9%. Policy was about as far behind as it’s ever been, and catching up took 525 basis points. Today the Fed is starting from 3.75% to 4.00%, real rates are around zero instead of deeply negative, and inflation is running in the mid-3% range with a good portion of that coming from energy prices rather than the surge in demand we saw coming out of the pandemic. After September’s move, the Fed’s projections call for one more quarter-point hike this year and then a hold through 2027. Projections can change quickly and the Fed has been clear it isn’t committing to a path, so I wouldn’t rule out a longer cycle. But with a lot less ground to make up, there’s a reasonable case to be made that this one is shorter and shallower than the last.
If the cycle does stay modest, how much would deposit costs actually go up? I think there’s a case to be made on both sides. The same stickiness that kept nonmaturity deposit costs from falling during the cuts could work in banks’ favor now. Since most institutions never lowered those rates, the gap between what they pay and where the Fed sits narrowed by roughly 175 basis points over the last two years. A hike or two only gives back part of that, and a lot of banks may find they can absorb it without changing posted rates on checking, savings, and money market accounts.
CDs are a different story. They repriced lower as they matured during the cuts, and CD pricing tends to follow the short end of the curve pretty closely. That means maturing CDs will likely roll at somewhat higher rates if the Fed follows through. Customers who pay attention to rates will see the headlines too, and with loan-to-deposit ratios above 80%, there’s less room to let balances walk than there was in 2022.
The most likely outcome is probably somewhere in between, with a modest increase in funding costs concentrated in CDs and the most rate-sensitive accounts instead of a broad repricing of the whole deposit base. That's a very different picture than the last cycle and a manageable one, as long as the assumptions in the model reflect it.
To bring us back to the original question of what’s next for deposits, if the Fed’s projections hold, the answer is probably a modest increase and not a repeat of the last cycle. Even still, the deposits on our balance sheets today aren’t the same deposits we had in 2021, and the assumptions in our models should reflect that. That’s not a reason for alarm. It’s simply a good time to make sure your model is built for the balance sheet you have today and not the one you had five years ago.
The Baker Group is one of the nation’s largest independently owned securities firms specializing in investment portfolio management for community financial institutions.
Since 1979, we’ve helped our clients improve decision-making, manage interest rate risk, and maximize investment portfolio performance. Our proven approach of total resource integration utilizes software and products developed by Baker’s Software Solutions* combined with the firm’s investment experience and advice.

Author
Dillon Wiedemann
Senior Vice President of FSG
The Baker Group LP
800.937.2257
*The Baker Group LP is the sole authorized distributor for the products and services developed and provided by The Baker Group Software Solutions, Inc.
INTENDED FOR USE BY INSTITUTIONAL INVESTORS ONLY. Any data provided herein is for informational purposes only and is intended solely for the private use of the reader. Although information contained herein is believed to be from reliable sources, The Baker Group LP does not guarantee its completeness or accuracy. Opinions constitute our judgment and are subject to change without notice. The instruments and strategies discussed here may fluctuate in price or value and may not be suitable for all investors; any doubt should be discussed with a Baker representative. Past performance is not indicative of future results. Changes in rates may have an adverse effect on the value of investments. This material is not intended as an offer or solicitation for the purchase or sale of any financial instruments.