How is it already March? I guess I’ll blame it on February having 28 days. Normally, the first Friday of the month brings us a slew of employment data from the Bureau of Labor Statistics (BLS). However, the BLS decided that we weren’t (or they weren’t) quite ready to release new data to the public. I guess I wasn’t the only one who was surprised that it is already March! Next Friday, the BLS will release the Employment Situation data for the month of February.
Monday brought us durable goods orders and orders for manufactured goods declined 4.5% in January. This reading followed December’s increase of 4% and came in slightly weaker than the market expectation for a decrease of 4%. If you exclude transportation, “core” durable goods were up 0.7% month over month.
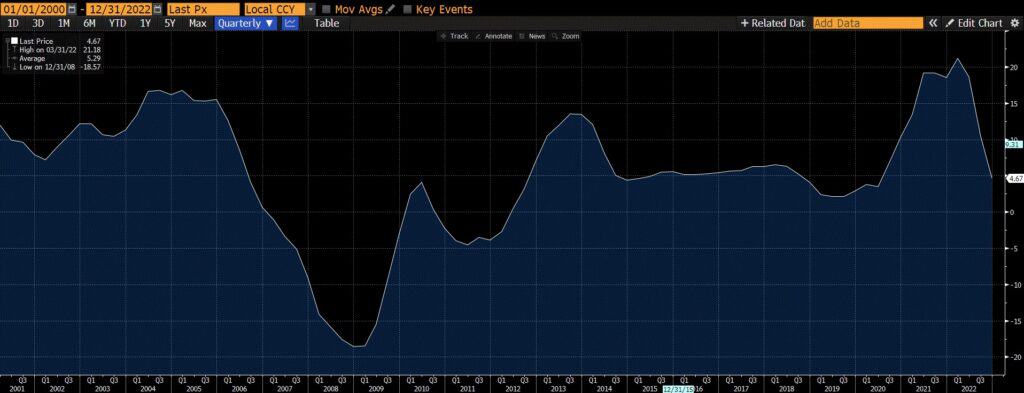
On Tuesday, we gained a little more insight into how real estate prices are holding up. The S&P/Case-Shiller 20-City Index fell by 0.51% month over month and increased 4.65% year over year. The Case-Shiller Home Price Indices for December is actually a 3-month average of October, November and December closing pricing. October closing prices include some contracts singed in August, so there is significant lag to this data. The S&P/Case-Shiller National Index also fell by 0.35% month over month. The average 30-year mortgage rate is around 7% which continues to weigh on home prices.
The ISM Manufacturing Index for February was released Wednesday and came in at a 47.7. This marks the fourth straight month that manufacturing contracted as a reading less than 50 signals a contraction of the manufacturing sector. Also released on Wednesday was the ISM Prices Index came in at 51.3, above estimates for a reading of 46.7.
This morning, we found out that the US service sector expanded in February by more than forecasted. The ISM Service Index came in at 55.1 (est. 54.5) reflecting expansion or growth in services. The data also suggests that service providers are having more success hiring after having trouble attracting workers throughout the pandemic.
As mentioned earlier, next week will bring us the latest Employment Situation release from the BLS. The current consensus estimate is for a 200,000 increase in nonfarm payrolls for the month of February. Additionally, the estimate for the year over year Average Hourly Earnings Change is 4.8% and an Unemployment Rate remaining unchanged at 3.4%. The monthly JOLTS report will also come out next week giving us insight into the number of open jobs as well as job hiring, layoff and quits data.
Let’s check in on the markets this morning! The 2-Year Treasury is sitting at 4.90% with the 10-Year Treasury sitting just above 4% at 4.01%. These levels reflect an 89-basis point inversion between the two points on the Treasury Yield Curve. The 30-Year Treasury Bond is seeing a stronger rally as the price is up 1 point with the yield falling down to 3.93%. Stocks are up early in today’s trading session with the Dow Jones Industrial Average up 122 points and the S&P 500 up 33 points.
Have a great weekend! It’s March Madness time!
Case-Shiller 20-City Composite Home Price Seasonally Adjusted Index YOY Change (2000 to Present)
The Baker Group is one of the nation’s largest independently owned securities firms specializing in investment portfolio management for community financial institutions.
Since 1979, we’ve helped our clients improve decision-making, manage interest rate risk, and maximize investment portfolio performance. Our proven approach of total resource integration utilizes software and products developed by Baker’s Software Solutions* combined with the firm’s investment experience and advice.

Author
Dale Sheller
Managing Director
Director of Financial Strategies Group
The Baker Group LP
800.937.2257
*The Baker Group LP is the sole authorized distributor for the products and services developed and provided by The Baker Group Software Solutions, Inc.
INTENDED FOR USE BY INSTITUTIONAL INVESTORS ONLY. Any data provided herein is for informational purposes only and is intended solely for the private use of the reader. Although information contained herein is believed to be from reliable sources, The Baker Group LP does not guarantee its completeness or accuracy. Opinions constitute our judgment and are subject to change without notice. The instruments and strategies discussed here may fluctuate in price or value and may not be suitable for all investors; any doubt should be discussed with a Baker representative. Past performance is not indicative of future results. Changes in rates may have an adverse effect on the value of investments. This material is not intended as an offer or solicitation for the purchase or sale of any financial instruments.