
Municipal issuance is on pace for a third consecutive record year, with dealers forecasting roughly $600 billion of new supply in 2026 after 2025’s record of about $580 billion. For municipal bondholders, the question is not whether the market can absorb the supply — so far, it has. Rather, the question is whether the debt being issued to fund this infrastructure wave is being taken on prudently at the issuer level, or whether it is quietly eroding the credit cushion that underpins the municipal market’s safe reputation built on extremely low default rates and the security of taxing power and essential services.
Why Debt Levels Are Rising
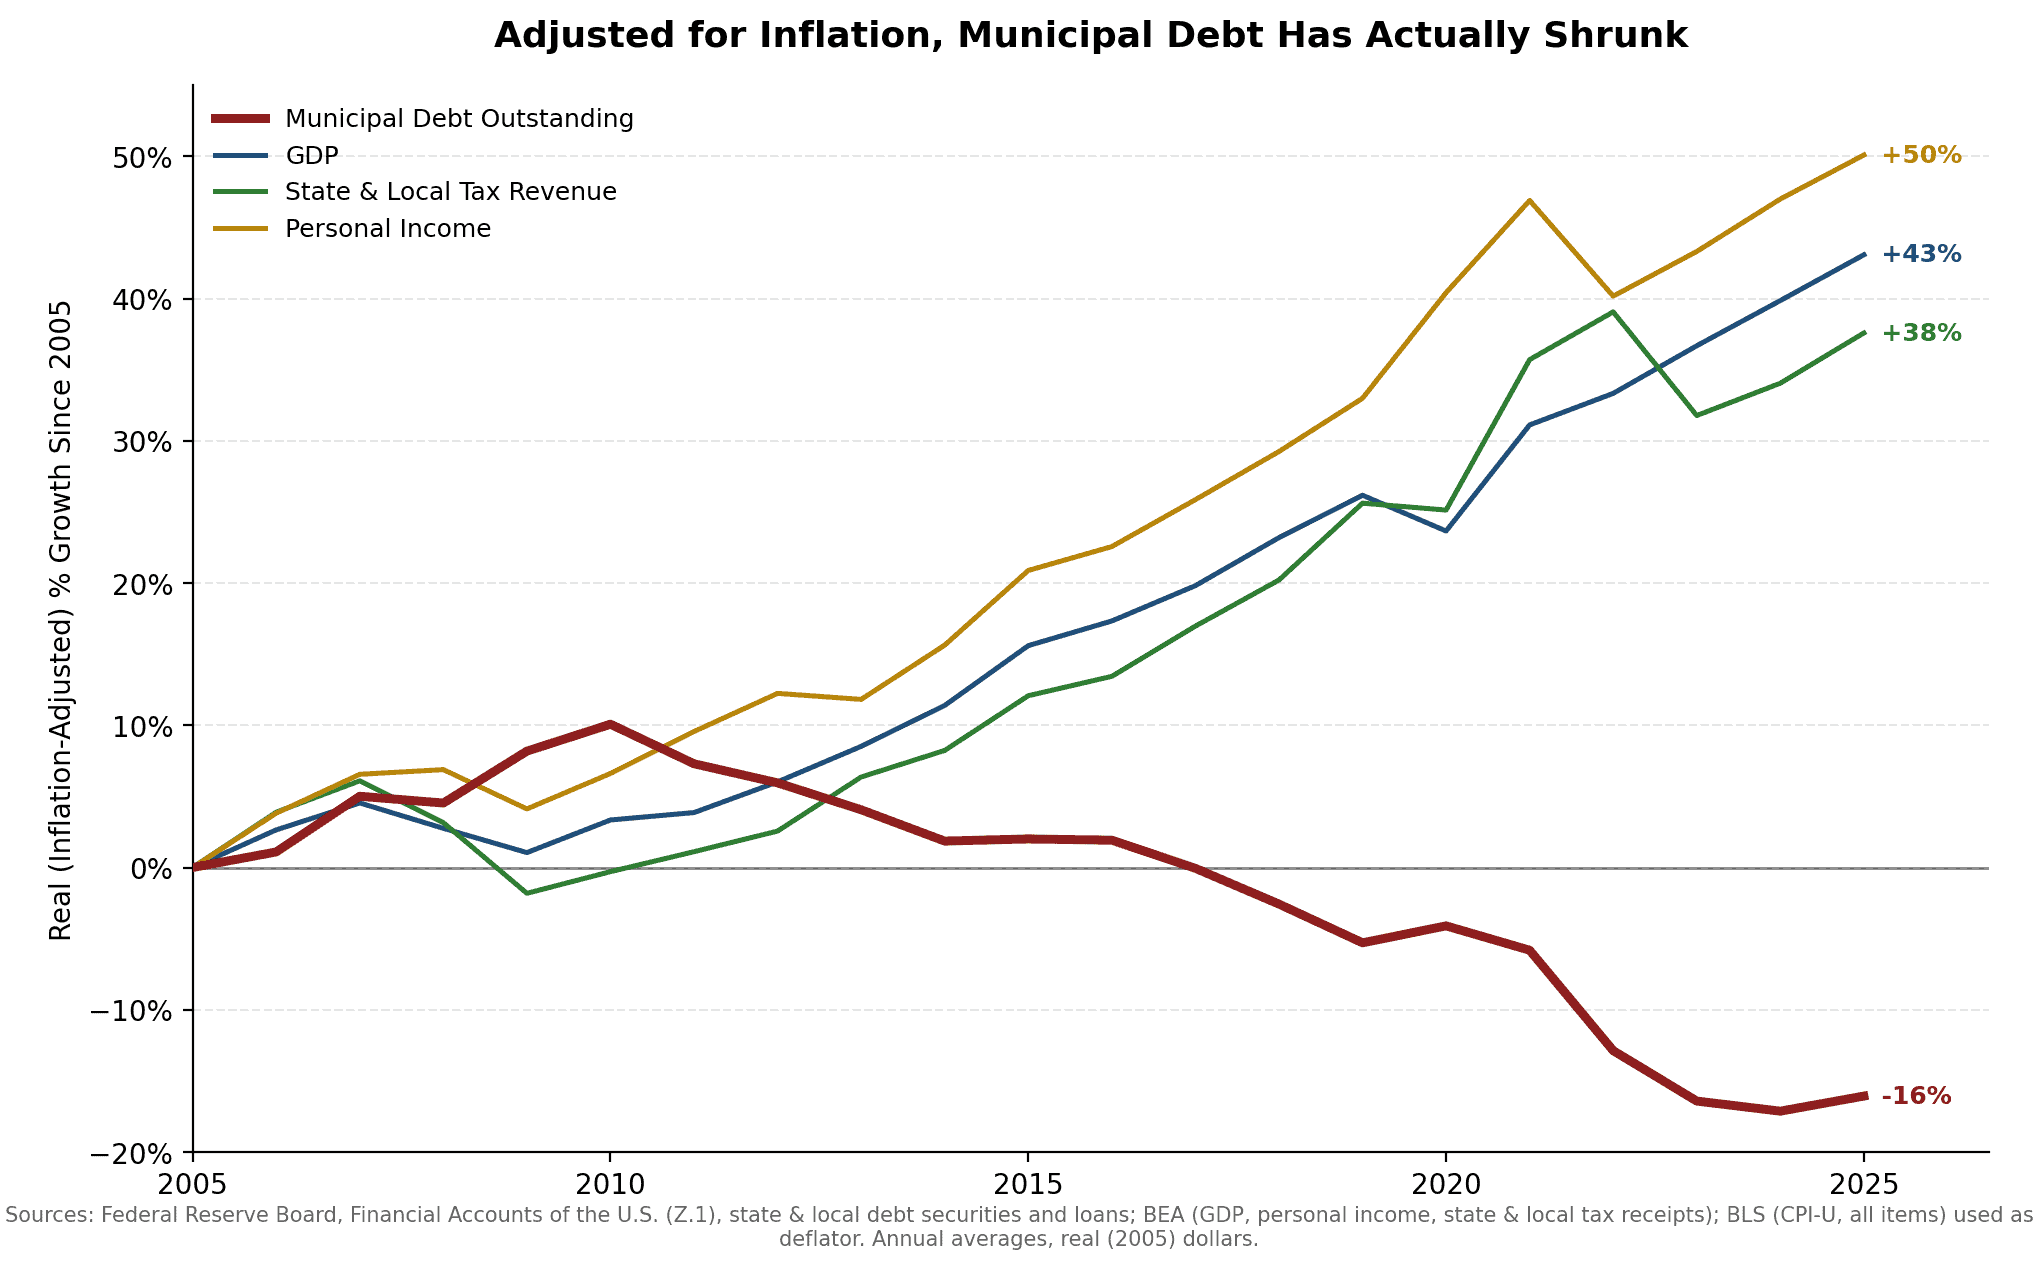
As demonstrated in the chart below, aggregate municipal debt outstanding has shrunk roughly 16% since 2005 in inflation-adjusted terms, even as GDP, state and local tax revenue, and personal income all grew by 38% or more.
However, several forces are compounding at once to push both debt levels and debt service costs higher. First, aging infrastructure needs to be replaced. The American Society of Civil Engineers’ latest report card shows the national infrastructure funding gap widening to $3.7 trillion, up from $2.6 trillion four years earlier. Second, demand for additional infrastructure is adding to that burden. For example, public power utilities are raising capital to meet AI-driven data center load, population migration necessitates more capital investment in some areas like Texas and Florida, and physical mitigants to manage climate risk are increasingly important.
Meanwhile, the federal support that let issuers avoid debt in recent years is fading. Pandemic-era stimulus that funded pay-as-you-go capital projects has run out, leading to a larger proportion of capital projects that will need to be funded with bond proceeds. Timing compounds the problem as both construction costs and borrowing rates are elevated. Many issuers delayed projects as interest rates rose, expecting a pullback that never fully came, and are now financing those same plans at rates well above what they could have locked in a few years earlier. At the same time, inflation has caused construction costs to increase rapidly, making these projects much more expensive.
That said, higher debt isn’t inherently a problem for every issuer. Many municipalities are currently well-positioned with high reserves, strong revenue sources, and conservative budgeting practices but also with legitimate needs for increasing leverage. However, risk arises from debt and associated costs outpacing an issuer’s capacity to manage them, particularly if additional capital needs keep surfacing while revenue and reserve growth slows or reverses. Below are some credit indicators to help manage that risk.
Credit Indicators to Monitor
- Debt-load metrics. Materially rising debt per capita and debt/assessed ratios signal a tax base that’s being asked to support more debt without a commensurate increase in capacity. Overlapping debt is also enlightening as a taxpayer inside overlapping jurisdictions can carry a much heavier load than any single issuer’s balance sheet suggests.
- Reserve erosion relative to debt service. Watch the general fund balance relative to annual debt service, and whether the issuer is drawing down reserves to cover recurring operating costs rather than one-time items.
- Taxpayer concentration. If a small number of taxpayers account for a large share of assessed value, the credit is more fragile than the aggregate numbers imply. The departure or downsizing of one large employer or taxpayer can move the tax base materially.
- Tax collection rate. A decreasing collection rate is an important distress signal — it reflects real-time taxpayer stress and local administrative capacity to enforce collections.
- Disclosure and administrative behavior. Late or missing continuing disclosure filings, delayed audits, or qualified/adverse audit opinions tend to correlate with weaker management generally, and non-compliance itself can raise an issuer’s cost of funds independent of the underlying credit.
- Low or falling coverage ratio on revenue bonds. An issuer that repeatedly issues new parity debt against the same revenue stream dilutes its debt coverage. A low coverage ratio leaves less cushion to absorb a revenue shortfall before payment is at risk.
The Bottom Line
Infrastructure investment is genuinely needed, and the municipal bond market remains a proven avenue to fund it with historically solid credit quality. The recent pickup in issuance appears to be normalization of debt levels, but investors should stay vigilant. Debt raised against durable, well-supported revenue is different than debt raised against optimistic assumptions or by issuers already in a fragile financial state. Instead of evaluating a debt increase in isolation, investors should comprehensively analyze the issuer’s ability to sustainably carry the additional debt. The Baker Group’s credit analysts are available to help you apply this framework to specific issuers in your portfolio.
The Baker Group is one of the nation’s largest independently owned securities firms specializing in investment portfolio management for community financial institutions.
Since 1979, we’ve helped our clients improve decision-making, manage interest rate risk, and maximize investment portfolio performance. Our proven approach of total resource integration utilizes software and products developed by Baker’s Software Solutions* combined with the firm’s investment experience and advice.

Author
Dana Sparkman, CFA
Executive Vice President/Municipal Analyst
The Baker Group LP
800.937.2257
*The Baker Group LP is the sole authorized distributor for the products and services developed and provided by The Baker Group Software Solutions, Inc.
INTENDED FOR USE BY INSTITUTIONAL INVESTORS ONLY. Any data provided herein is for informational purposes only and is intended solely for the private use of the reader. Although information contained herein is believed to be from reliable sources, The Baker Group LP does not guarantee its completeness or accuracy. Opinions constitute our judgment and are subject to change without notice. The instruments and strategies discussed here may fluctuate in price or value and may not be suitable for all investors; any doubt should be discussed with a Baker representative. Past performance is not indicative of future results. Changes in rates may have an adverse effect on the value of investments. This material is not intended as an offer or solicitation for the purchase or sale of any financial instruments.